IoT Center – a Demo IoT Monitoring Application
Template built by
Included Resources:
- 1 Bucket:
iot_center - 1 Label:
IoT - 1 Dashboards:
IoT Center Application Monitoring - 1 Variable:
IoT_Device
Quick Install
If you have your InfluxDB credentials configured in the CLI, you can install this template with:
IoT Center dashboard
The IoT Center is a simple JavaScript-enabled demo application that showcases the capabilities of the InfluxDB platform. It collects, stores and displays a set of values that include temperature, humidity, pressure, CO2 concentration, air quality, as well as provides GPS coordinates from a set of IoT devices. With this data stored in InfluxDB, the application can query this data for display as well as write data back into the database.
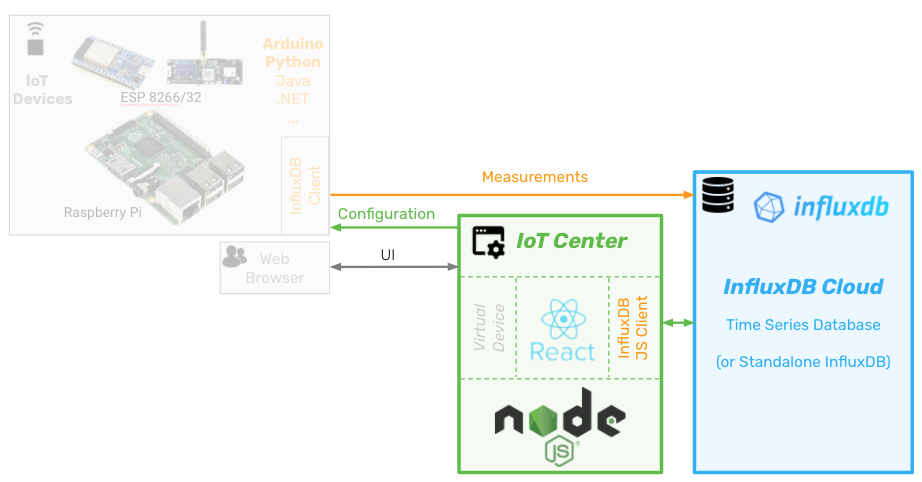
IoT Center is based on Node.js and React and writes measurements into an instance of InfluxDB as well as queries that same database with the use of the InfluxDB JavaScript client libraries.

High-level architecture of the IoT Center demo application
Why an InfluxDB template for the IoT Center demo application?
As you walk through the instructions of the IoT Center demo application, you can use this pre-made InfluxDB template with your InfluxDB Cloud account to see how the queries can be structured as a part of your learning.
How to use the IoT Center Template
The complete documentation to run this demo application can be found here.
- Load the dashboard according to the paragraph above.
- Run IoT Center application according to the installation steps.
- Generate demo data using the Virtual devices.
Key metrics in the IoT Center Template
Some of the metrics include:
- Temperature
- Humidity
Related Resources
IoT monitoring and analytics
The solution to provide real-time insight and analytics from IoT sensors and devices.
Enviro+ Raspberry Pi
With Enviro + Air Quality for Raspberry Pi, it's never been easier to build your own air quality monitor from scratch using the existing resources that you're already comfortable with.
Island Pulse Monitoring Template
The Island Pulse Monitoring Template uses energy consumption data to showcase deploying the Modbus Telegraf plugin to collect data stored in InfluxDB. It shows energy consumption compared to previous periods.

